The following information was previously provided to subscribers of BDC Buzz Premium Reports along with:
- Target prices, buying points, and suggested limit orders (used during market volatility).
- Risk profile, potential credit issues, changes in NAV, and overall rankings. Please see BDC Risk Profiles for additional details.
- Dividend coverage projections (base, best, worst-case scenarios). Please see BDC Dividend Coverage Levels for additional details.
![]()

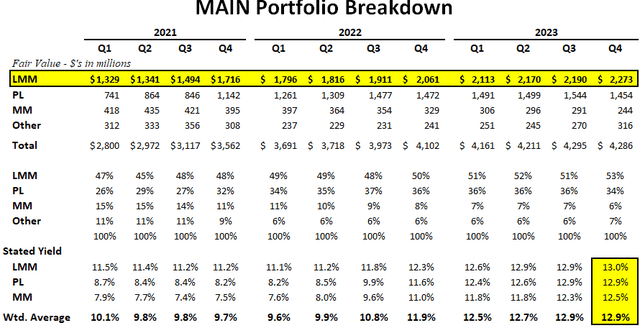
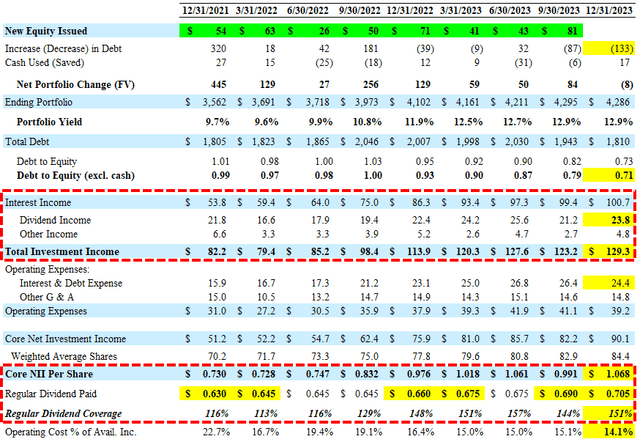
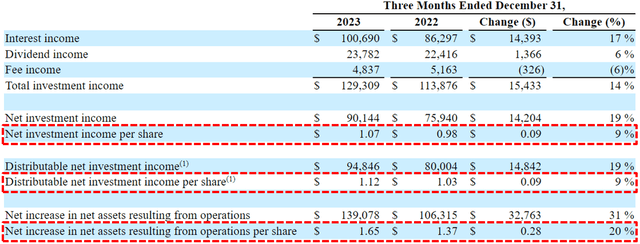
As expected in the previous weekly update, Main Street Capita (MAIN) provided preliminary estimates for Q4 2024 including the following highlights which will be taken into account in the updated MAIN Deep Dive Projection report:
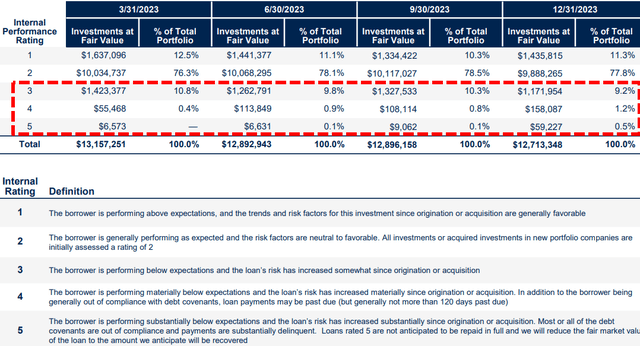
- Non-accrual investments decreased from 1.4% to 0.9% of the total portfolio at fair value and from 3.9% to 3.5% at cost as of December 31, 2024.
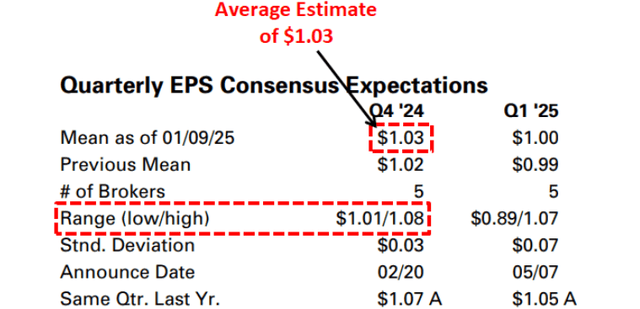
- Net investment income (“NII”) of $ 1.01 to $1.03 per share compared to analyst expectations of $1.03 per share.
- Distributable net investment income (“DNII”), which is NII before non-cash compensation expenses, is $1.07 to $1.09 per share compared to dividends paid of $1.035 per share (for Q4 2024).
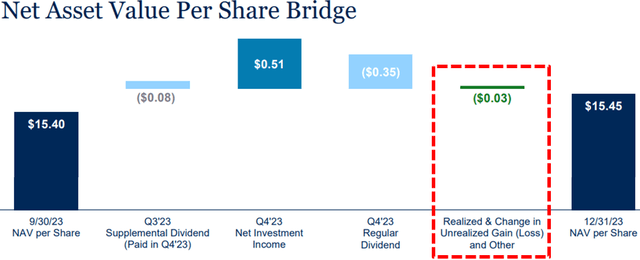
- NAV per share as of December 31, 2024, is $31.62 to $31.68, representing an increase of $1.05 to $1.11 per share, or 3.4% to 3.6%, from the NAV per share of $30.57 as of September 30, 2024.
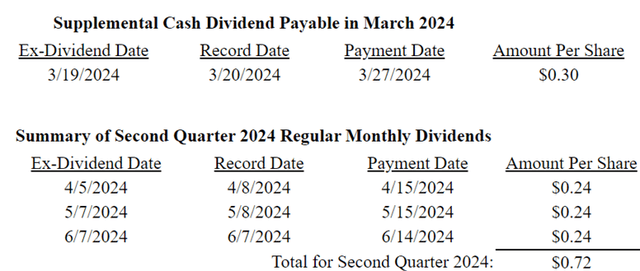
There was no specific discussion of “another meaningful supplemental dividend” for Q1 2025. However, on January 7, 2025, MAIN announced that it had fully exited its debt and equity investments in Pearl Meyer & Partners upon the completion of a majority recapitalization with a new financial sponsor. MAIN realized a gain of $53.7 million on the exit of its equity investment in Pearl Meyer with this realized value representing an increase of $6.2 million above MAIN’s fair market value for this investment as of September 30, 2024. The impact is a slight increase in NAV per share but around $0.60 per share of realized gains in Q1 2025 which could drive a larger supplemental dividend (in Q1) depending on the total net realized gains for the quarter.
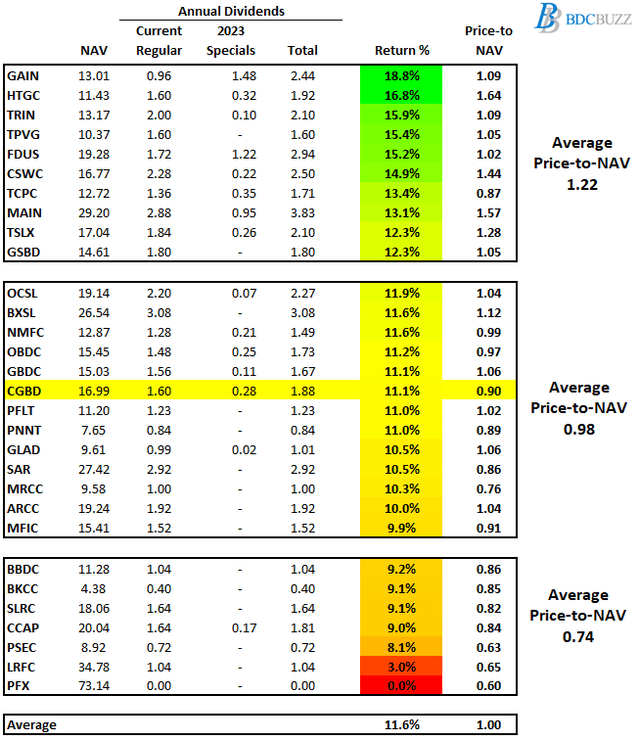
As shown below, the average NII/EPS estimate is/was around $1.03 per share (compared to the likely ~$1.02 per share), implying a slight earnings miss.

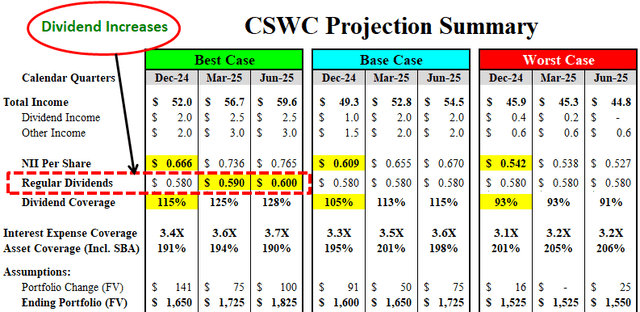
Last week, Capital Southwest (CSWC) announced its preliminary results for calendar Q4 2024 including pre-tax net investment income in the range of $0.63 to $0.64 per share and NAV per share in the range of $16.57 to $16.62.
“The preliminary estimate of its net investment income for the same period is in the range of $0.62 to $0.63 per share. Capital Southwest’s preliminary estimate of its investment assets at fair value as of December 31, 2024 is approximately $1.7 billion.”
This implies that its NAV per share remained relatively stable (previously $16.59) with higher-than-expected portfolio growth (previously $1.5 billion) and earnings between my previous base case projection of $0.609 per share and best-case of $0.666 per share:

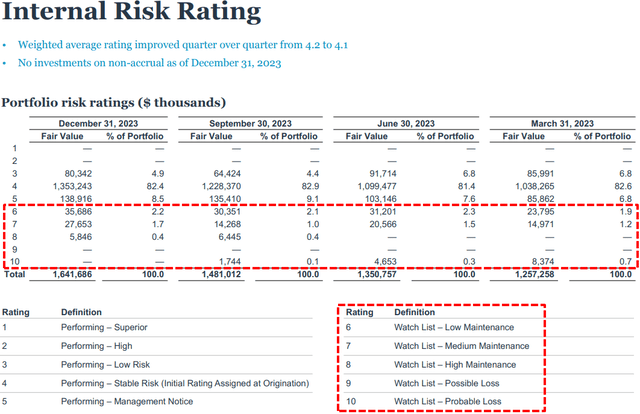
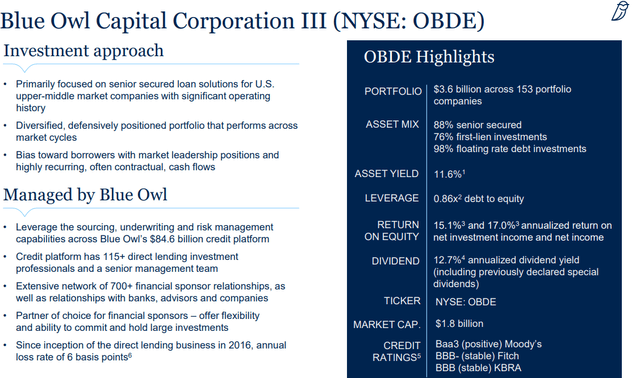
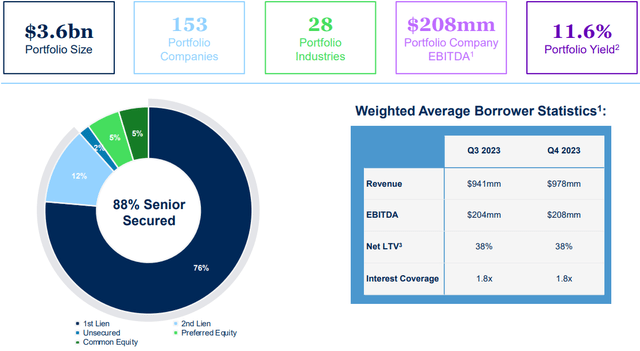
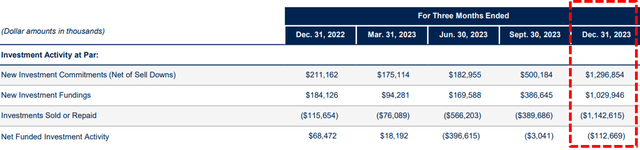
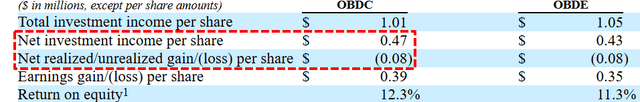
Also, Blue Owl Capital (OBDC) provided preliminary estimates for Q4 2024 including the following highlights which will be taken into account in the updated OBDC Deep Dive Projection report:
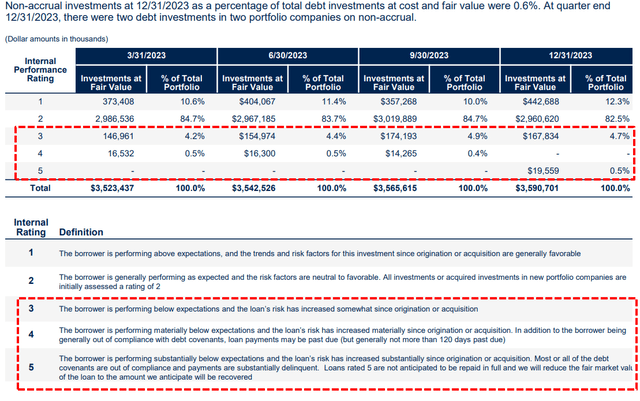
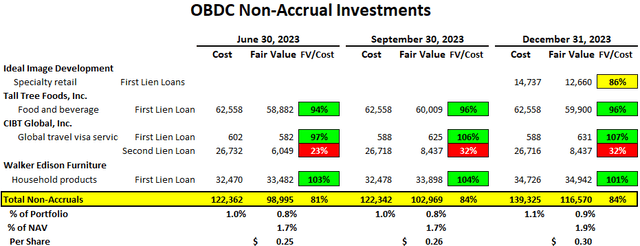
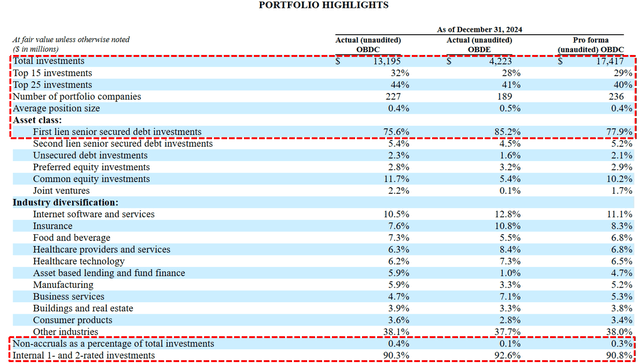
- Non-accrual investments for OBDC decreased from 0.6% to 0.4% of the total portfolio at fair value as of December 31, 2024, and 0.3% after taking into account the merger.
- Net investment income (“NII”) for OBDC of $0.47 per share compared to analyst expectations of $0.46 per share.
- NAV per share for OBDC as of December 31, 2024, was $15.26 (the same after taking into account the merger with OBDE) which is a slight decline from the previous $15.28.
- Net debt-to-equity (less cash) declined slightly from 1.23 to 1.19 as of December 31, 2024, and 1.20 after taking into account the merger with OBDE.
- The amount of first-lien investments increased slightly from 76% to 78%.


Trinity Capital (TRIN) announced the following Q4 2024 investment highlights which indicate another quarter of meaningful portfolio activity and are taken into account with the updated projections included in the recently updated TRIN Deep Dive Projection report.
- Proceeds received from repayments and exits totaled approximately $281 million, which included $130 million from early debt repayments, $15 million from warrant and equity exits, $59 million from scheduled/amortizing debt payments and $77 million from investments sold primarily to multi-sector holdings.
- Investments funded totaled approximately $297 million, which was comprised of $190 million in secured loans, $96 million in equipment financings and $11 million in warrant and equity investments.
- Originated approximately $411 million of new commitments, which was comprised of $231 million in secured loans, $173 million in equipment financings and $7 million in equity investments.
- Funded approximately $233 million to 9 new portfolio companies, $59 million to 15 existing portfolio companies and $5 million of investments to multi-sector holdings.
This would imply lower portfolio growth than previous quarters (likely around $15 million) but it is important to note that Q4 2024 will include a full quarter of benefit from Q3 2024 net new investments of around $260 million. Also, the $130 million of early repayments could drive a meaningful amount of prepayment-related income including accelerated OID and EOT, prepayment penalty, and related fees driving the results closer to the best-case projections. I will hopefully be purchasing additional shares before the company reports Q4 2024 results.

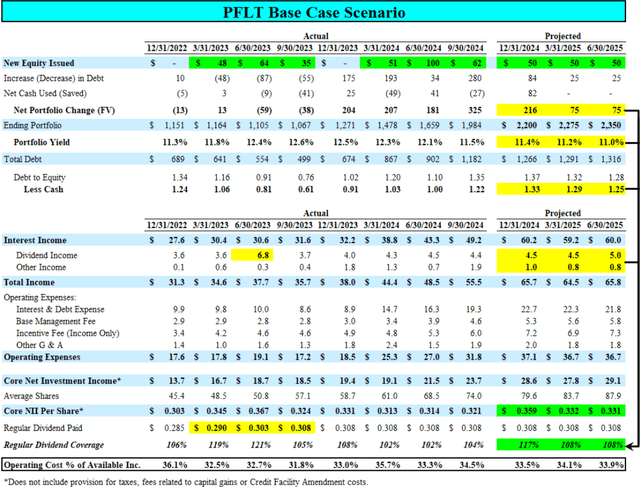
Also, PennantPark Floating Rate Capital (PFLT) disclosed the following Q4 2024 preliminary results in an SEC filing that will be taken into account with the updated projections (see base case later). Again, this information has NOT been announced in a “press release” and was from a recent SEC filing:
- NAV per share between $11.33 and $11.38 per share at December 31, 2024. This compares to a net asset value per share of $11.31 at September 30, 2024.
- Net investment income between $0.36 and $0.38 per share for the quarter ended December 31, 2024 and includes approximately $0.04 per share of one-time non-recurring income [mostly due to the exit of Marketplace Events driving accelerated amortization income associated with the early repayment], net of the impact on incentive fees. This compares to net investment income of $0.24 per share for the quarter ended September 30, 2024.
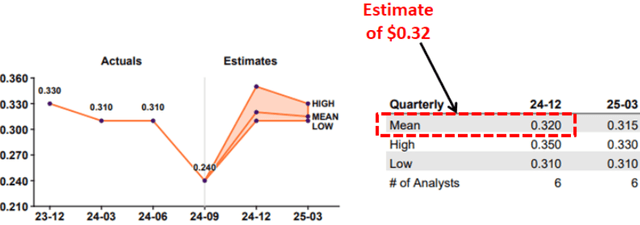
- Core net investment income (excluding one-time or non-recurring investment income and expenses) is estimated to be between $0.32 and $0.34 per share for the quarter ended December 31, 2024 and excludes approximately $0.04 per share of one-time non-recurring income related to accelerated amortization income associated with the early repayment of one of our loans, net of the impact on incentive fees.This compares to core net investment income of $0.32 per share for the quarter ended September 30, 2024.
- The investment portfolio at fair value was $2.20 billion, compared to $1.98 billion as of September 30, 2024.
- At December 31, 2024, there were two loans on non-accrual representing 0.4% of the portfolio at cost and 0.1% at fair market value versus two loans on non-accrual at September 30, 2024 representing 0.4% of the portfolio at cost and 0.2% at fair market value.
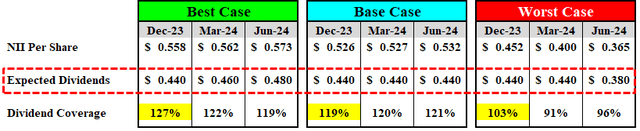
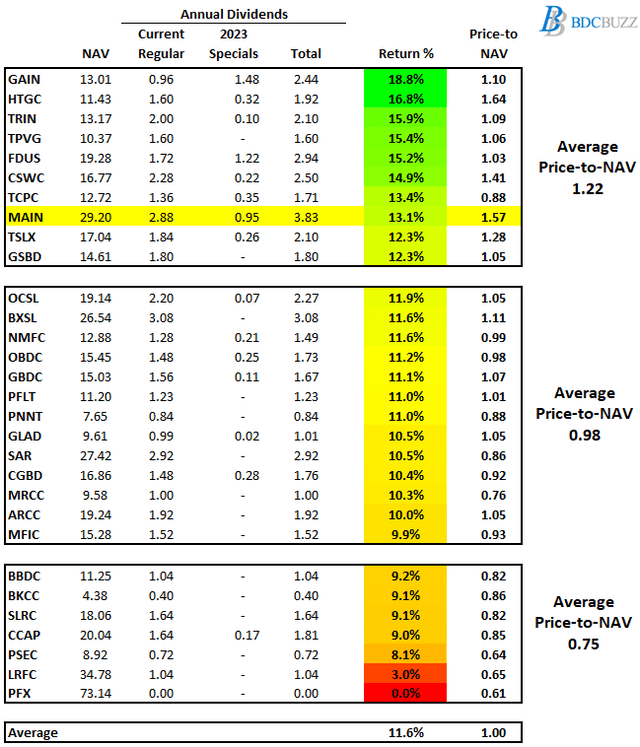
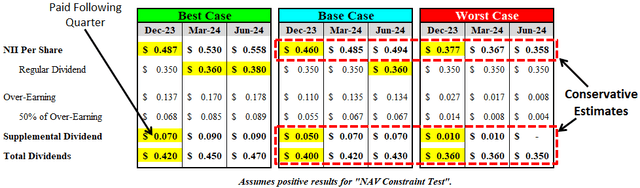
As shown later, PFLT is currently one of the best-priced BDCs with a stable dividend providing a current yield of 11.0%. Analysts were previously expecting earnings between $0.31 and $0.35 per share with an average near $0.32 per share for Q4 2024 implying an earnings beat (above the best case) as PFLT will report around $0.37 per share.
PFLT’s equity investment in New MPE Holdings (Marketplace Events) was exited during the quarter which represented 11.3% of the equity portfolio at September 30, 2024. In addition, in connection with the payoff of the Marketplace Events, the company recognized approximately $3.8 million of one-time non-recurring income related to accelerated amortization income associated with the early repayment of the loan. The equity position was valued at $20.1 million at September 30, 2024. In connection with the sale, we received $20.6 million in cash proceeds and anticipate receiving approximately $4.9 million of additional escrow proceeds in the future in connection with the terms of the sale. Please note that this will drive a meaningful amount of realized gains during Q4 2024 (depending on how many shares were issued during the quarter).
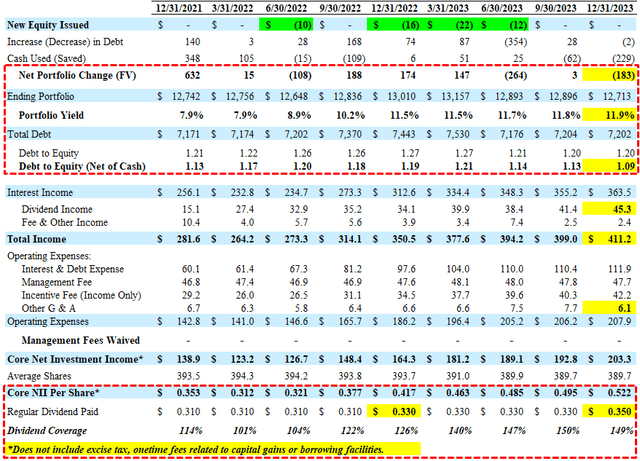
Please note that our financial projections err on the side of caution by using mostly conservative assumptions, and the preferred outcome is between the ‘Base’ and ‘Best’ case projections. As shown in the updated base case projections below, we are expecting PFLT to cover its dividends even as the portfolio yield declines while keeping modest leverage (debt-to-equity) making it a solid ‘Level 2’ dividend coverage BDC.
What Can I Expect Each Week With a Paid Subscription?
Each week we provide a balance between easy-to-digest general information to make timely trading decisions supported by the detail in the Deep Dive Projection reports (for each BDC) for subscribers that are building larger BDC portfolios.
- Weekly Updates – Before the markets open each Monday morning, we provide quick updates for the sector, including significant events for each BDC along with upcoming earnings, reporting, and ex-dividend dates. Also, we provide a list of the best-priced opportunities along with oversold/overbought conditions, and what to look for in the coming week.
- Deep Dive Projection Reports – Detailed reports on individual BDCs each week prioritized by focusing on buying opportunities and potential issues such as changes in portfolio credit quality and/or dividend coverage (usually related). This should help subscribers put together a shopping list ready for the next general market pullback.
- Weekly General Updates or Comparison Reports – A series of updates discussing ‘Building a BDC Portfolio’, suggested pricing and limit orders, expense/return ratios, interest rates, leverage, BDC Investment Grade Notes/Baby Bonds, portfolio mix, and potential impacts on dividend coverage and risk.
![]()